Live agent sessions
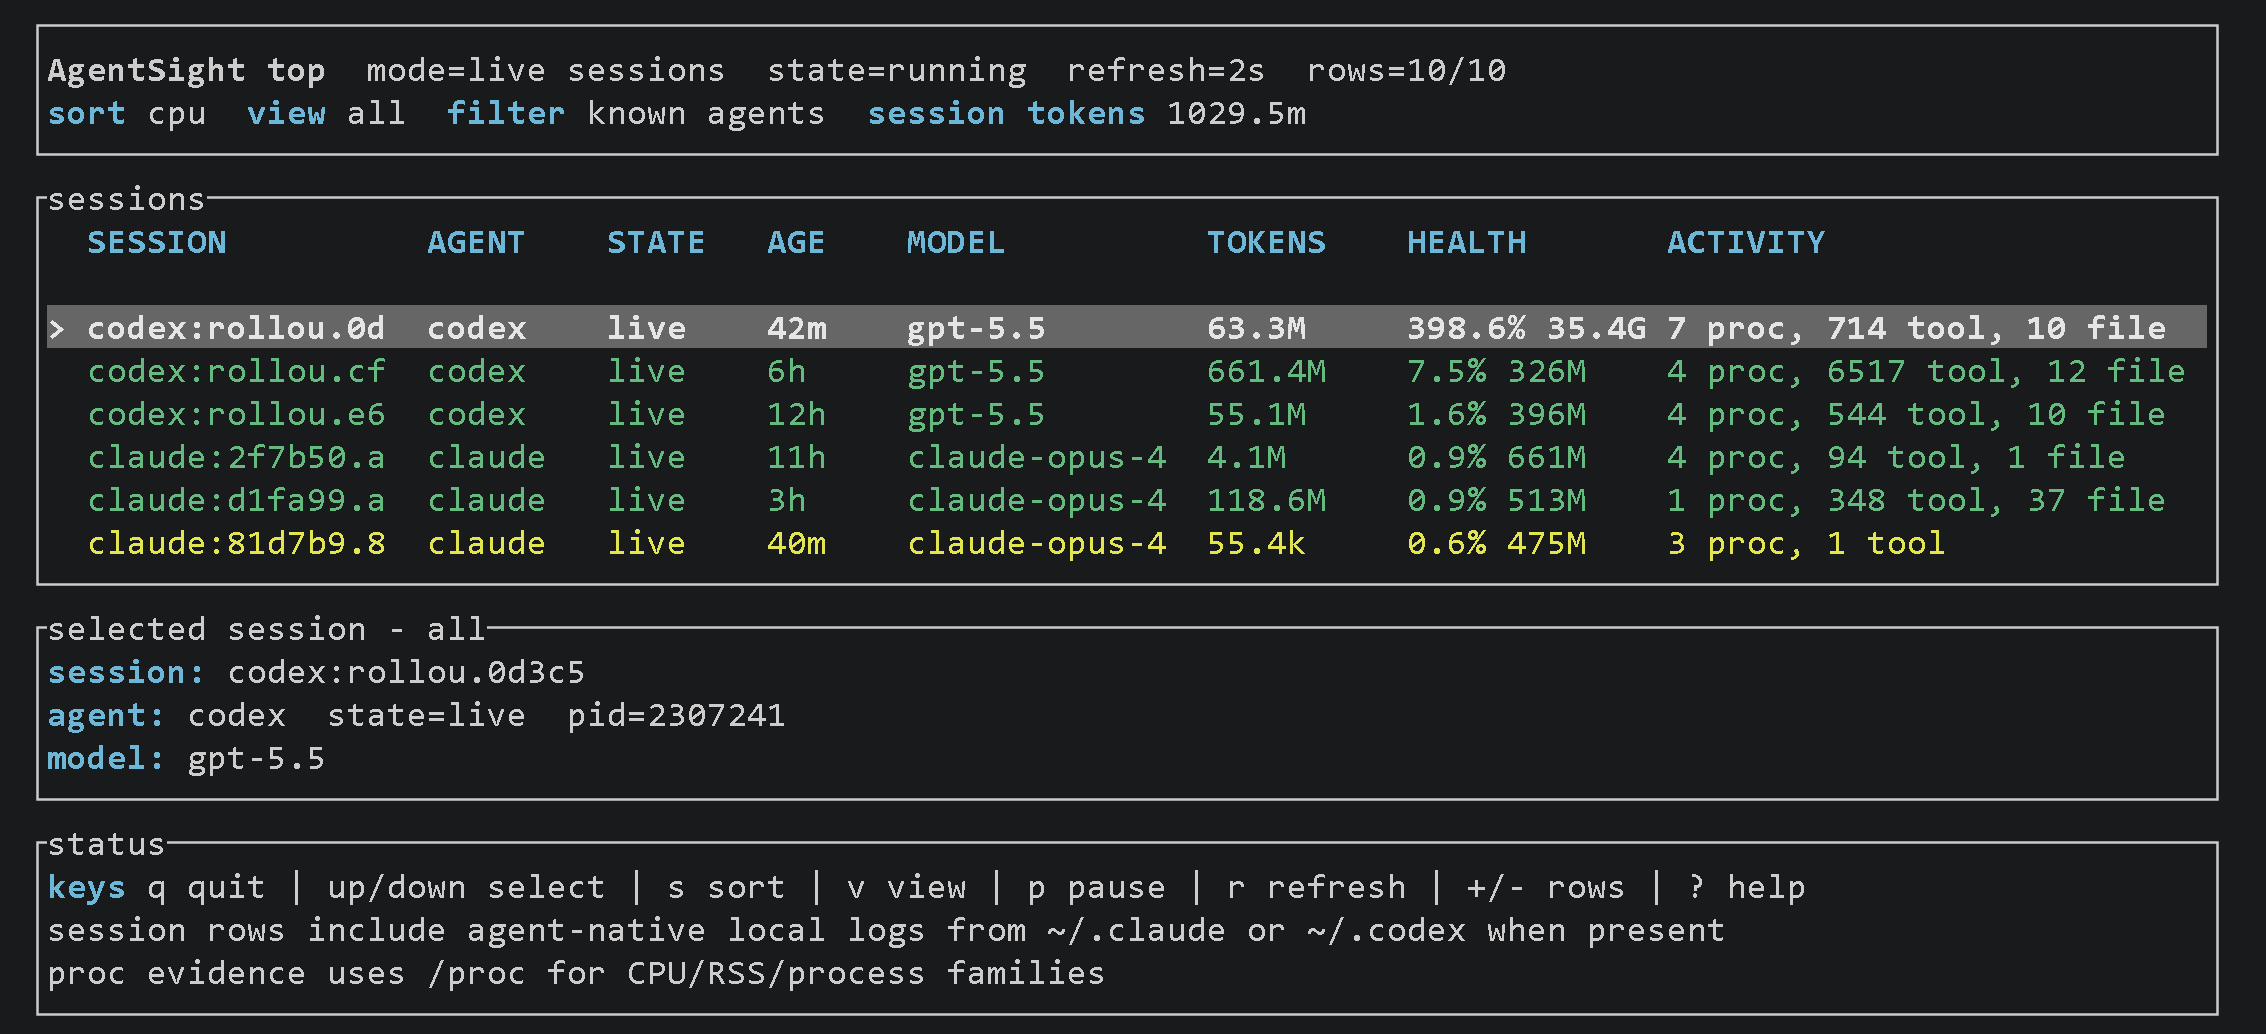
See active agents, models, tokens, health, tool calls, file activity, and network activity in one live view.
Open-source observability for AI agents
AgentSight is a local-first top/strace-like profiler for AI agents. It connects prompts and model calls to commands, files, processes, network activity, and resource use—without an SDK or proxy.
Works with the agents and runtimes you already use
One view of the whole run
Native agent telemetry is strongest for model, tool, and session semantics. AgentSight adds independent process-family, file, network, and resource observations when execution crosses those instrumentation boundaries.
See active agents, models, tokens, health, tool calls, file activity, and network activity in one live view.
Connect prompts, responses, model timing, and tool decisions to the rest of the run.
Follow commands and child processes with exit status, CPU, memory, I/O, and duration.
Track files created, changed, renamed, or deleted and the remote destinations contacted by the run.
Explore the product
Start with the Overview dashboard, then use the timeline, process tree, resource views, repository replay, and flamegraphs to inspect the part of the run that matters.
Overview dashboard
Review duration, tokens, model calls, processes, files, endpoints, activity over time, resource shape, and friction signals before drilling into detailed views.
Open this view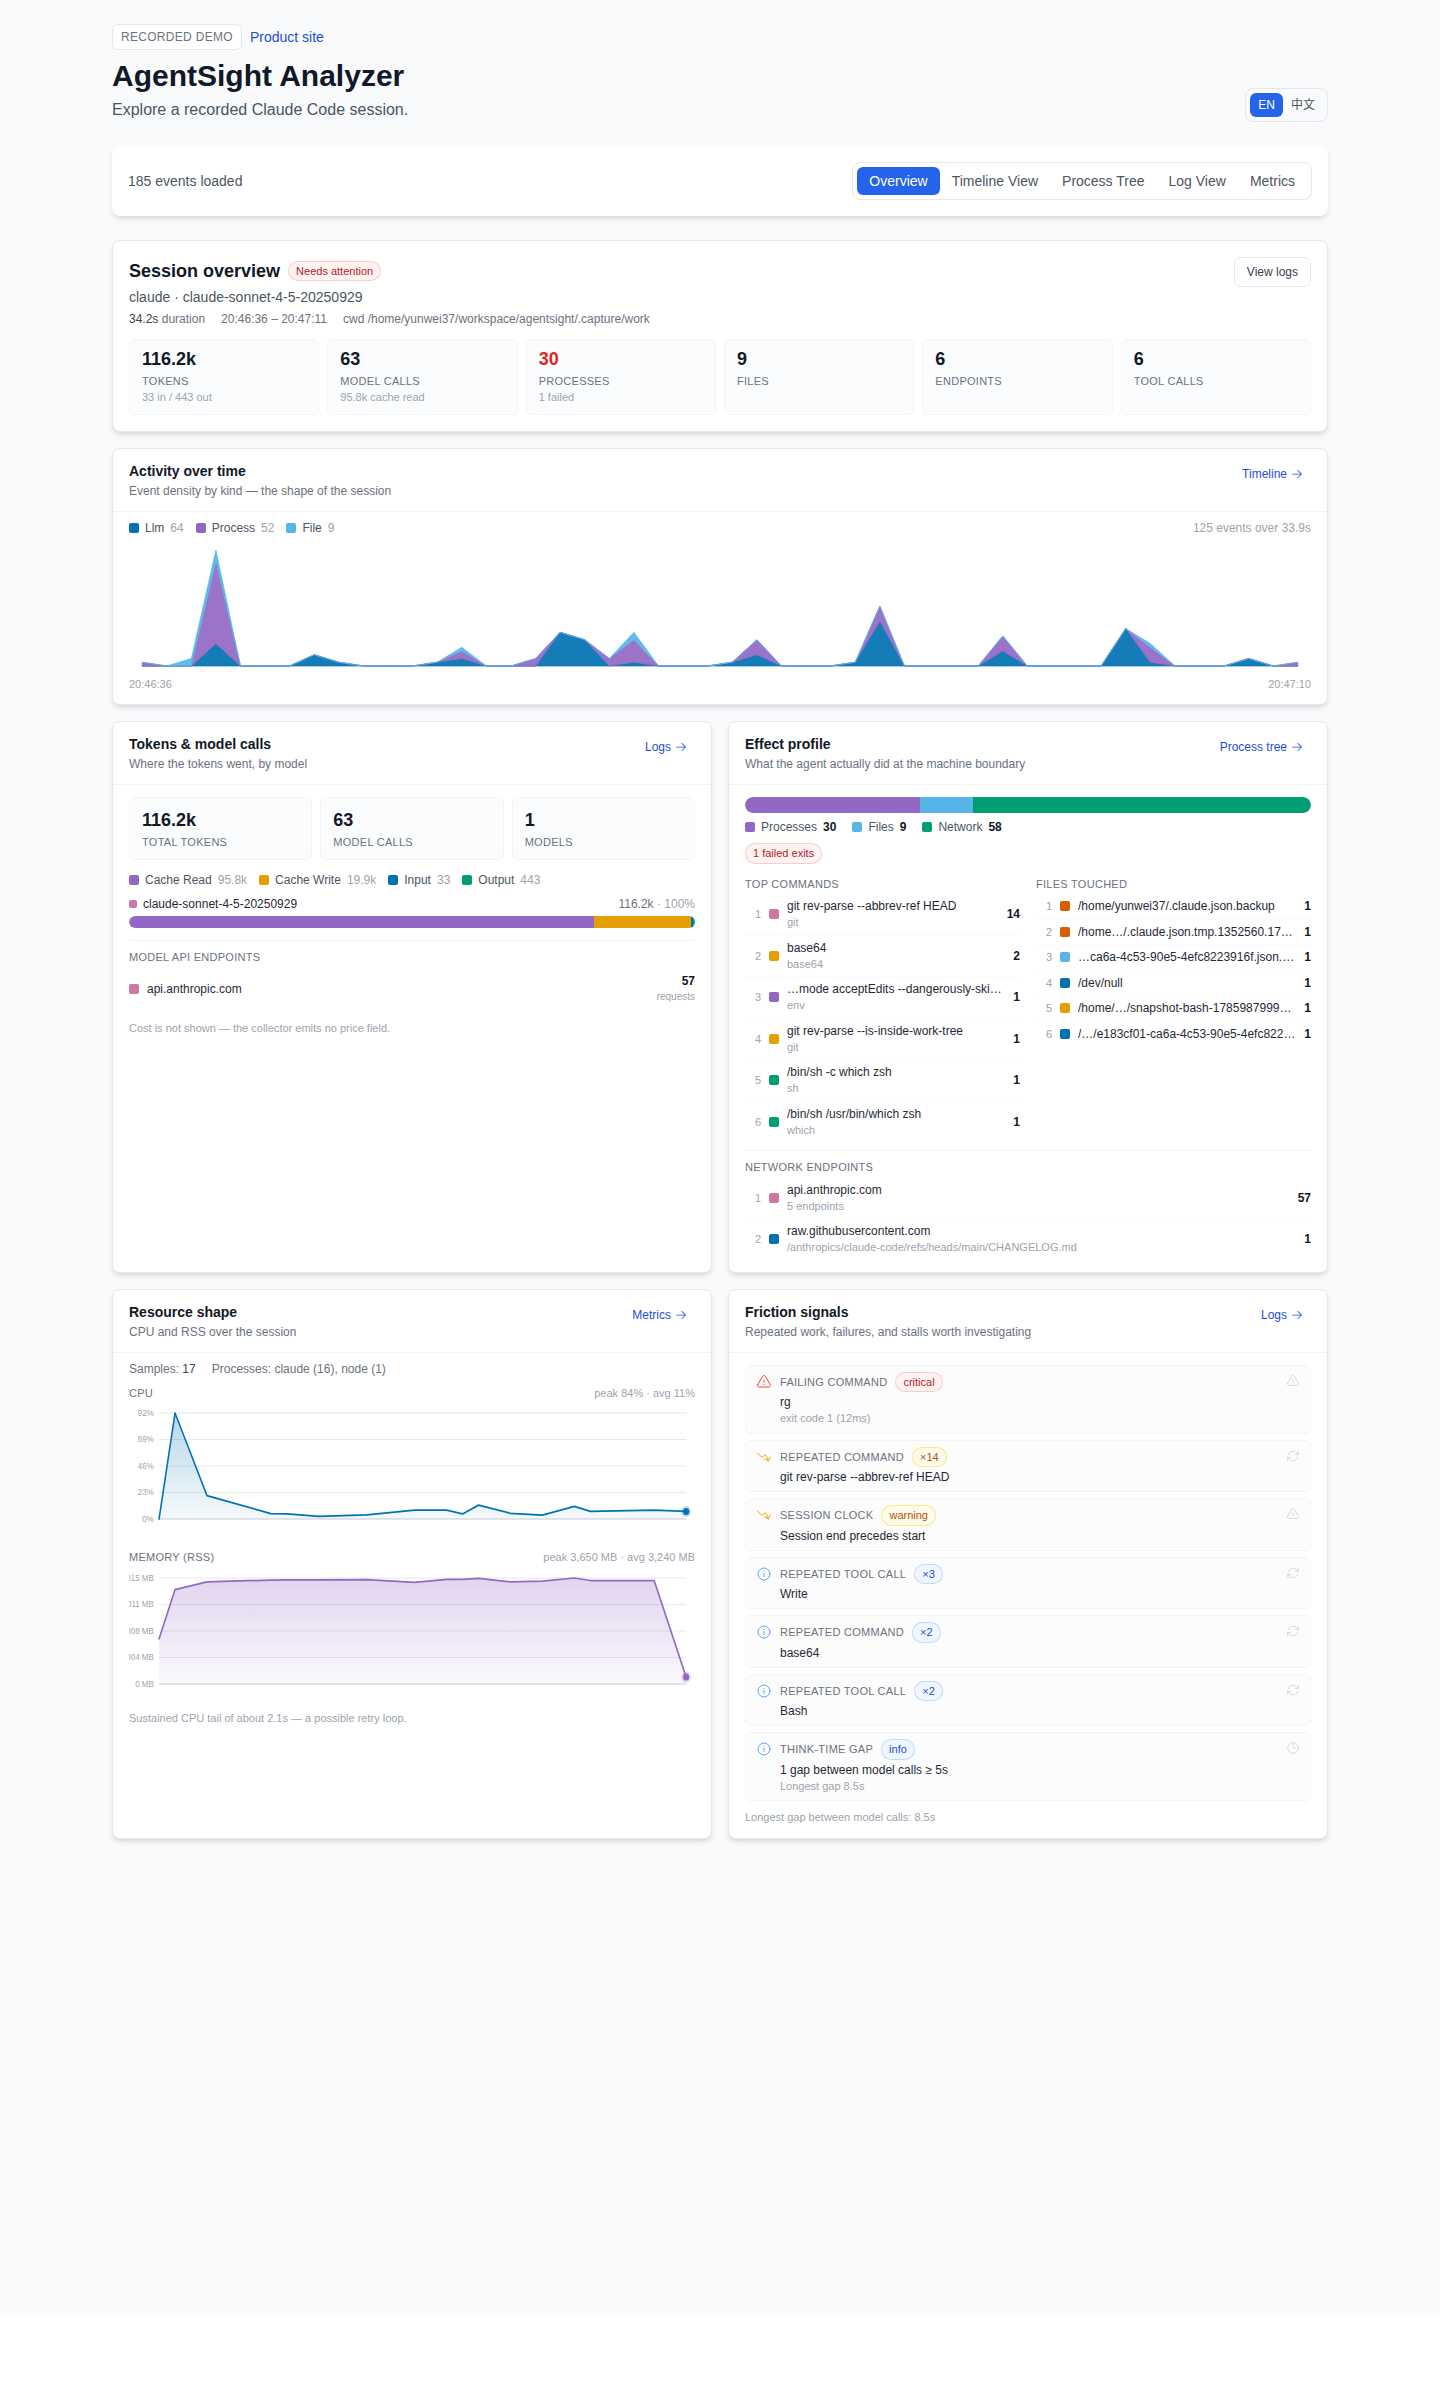
Timeline
Line up model calls, tool activity, processes, file operations, and network events on one timeline.
Open this view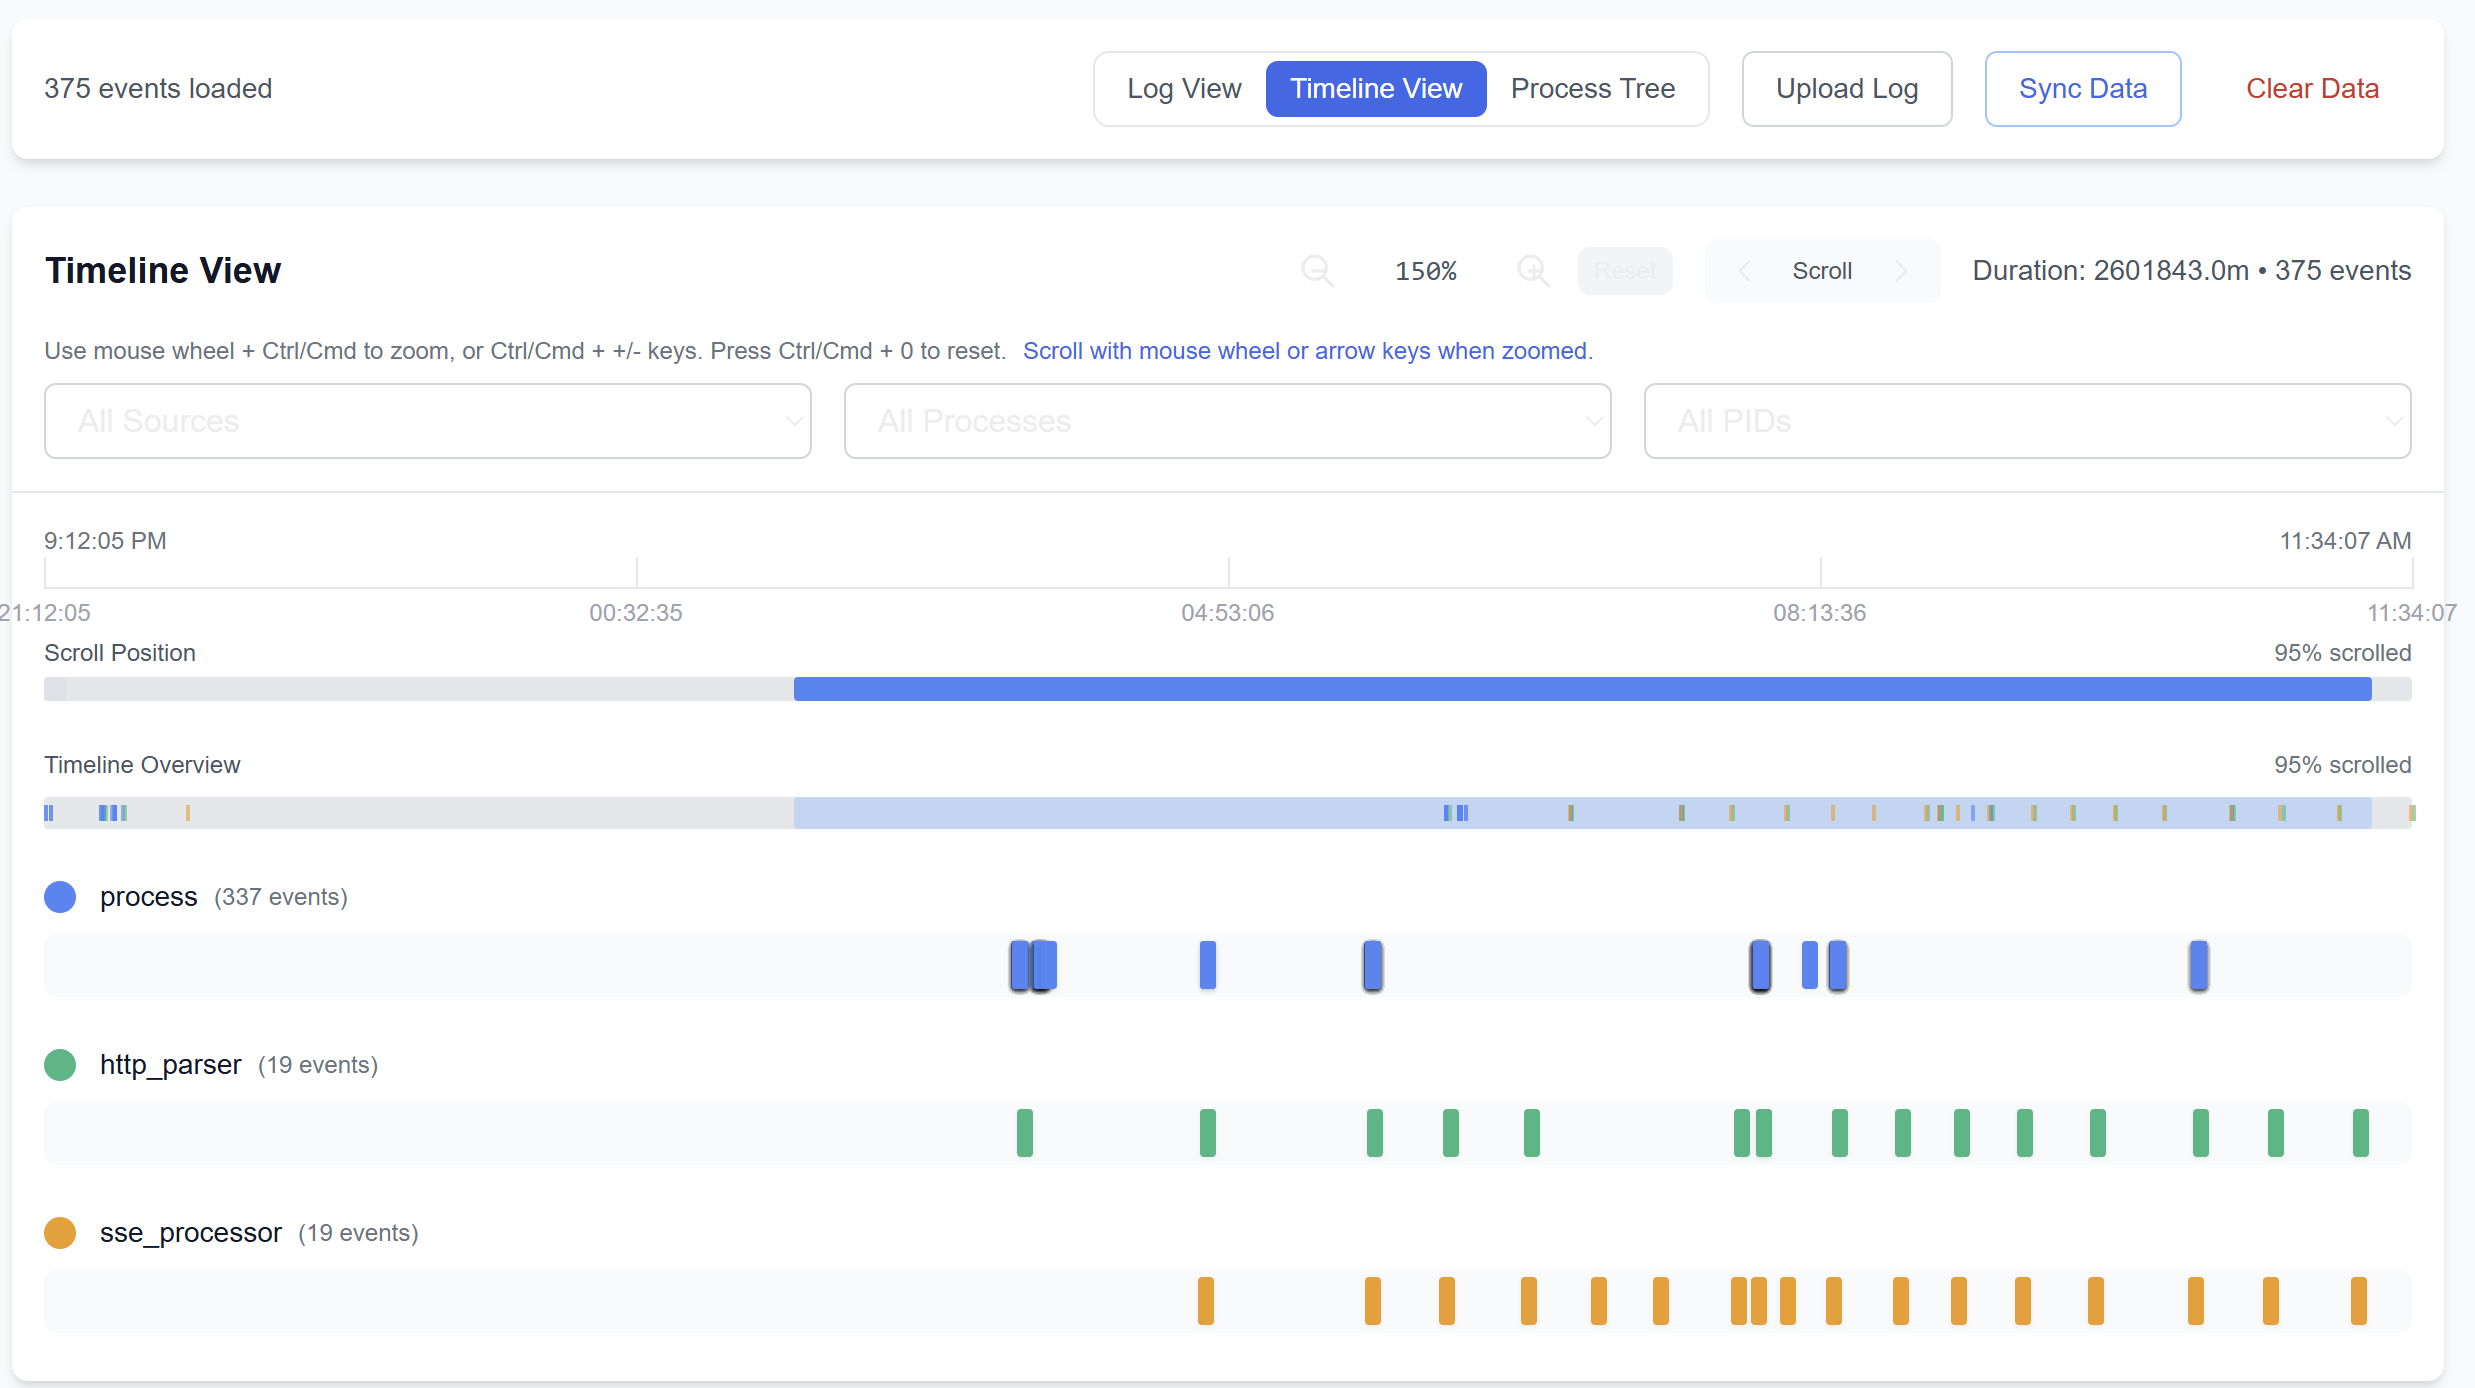
Process tree
Inspect child processes and file activity under the agent session that caused them.
Open this view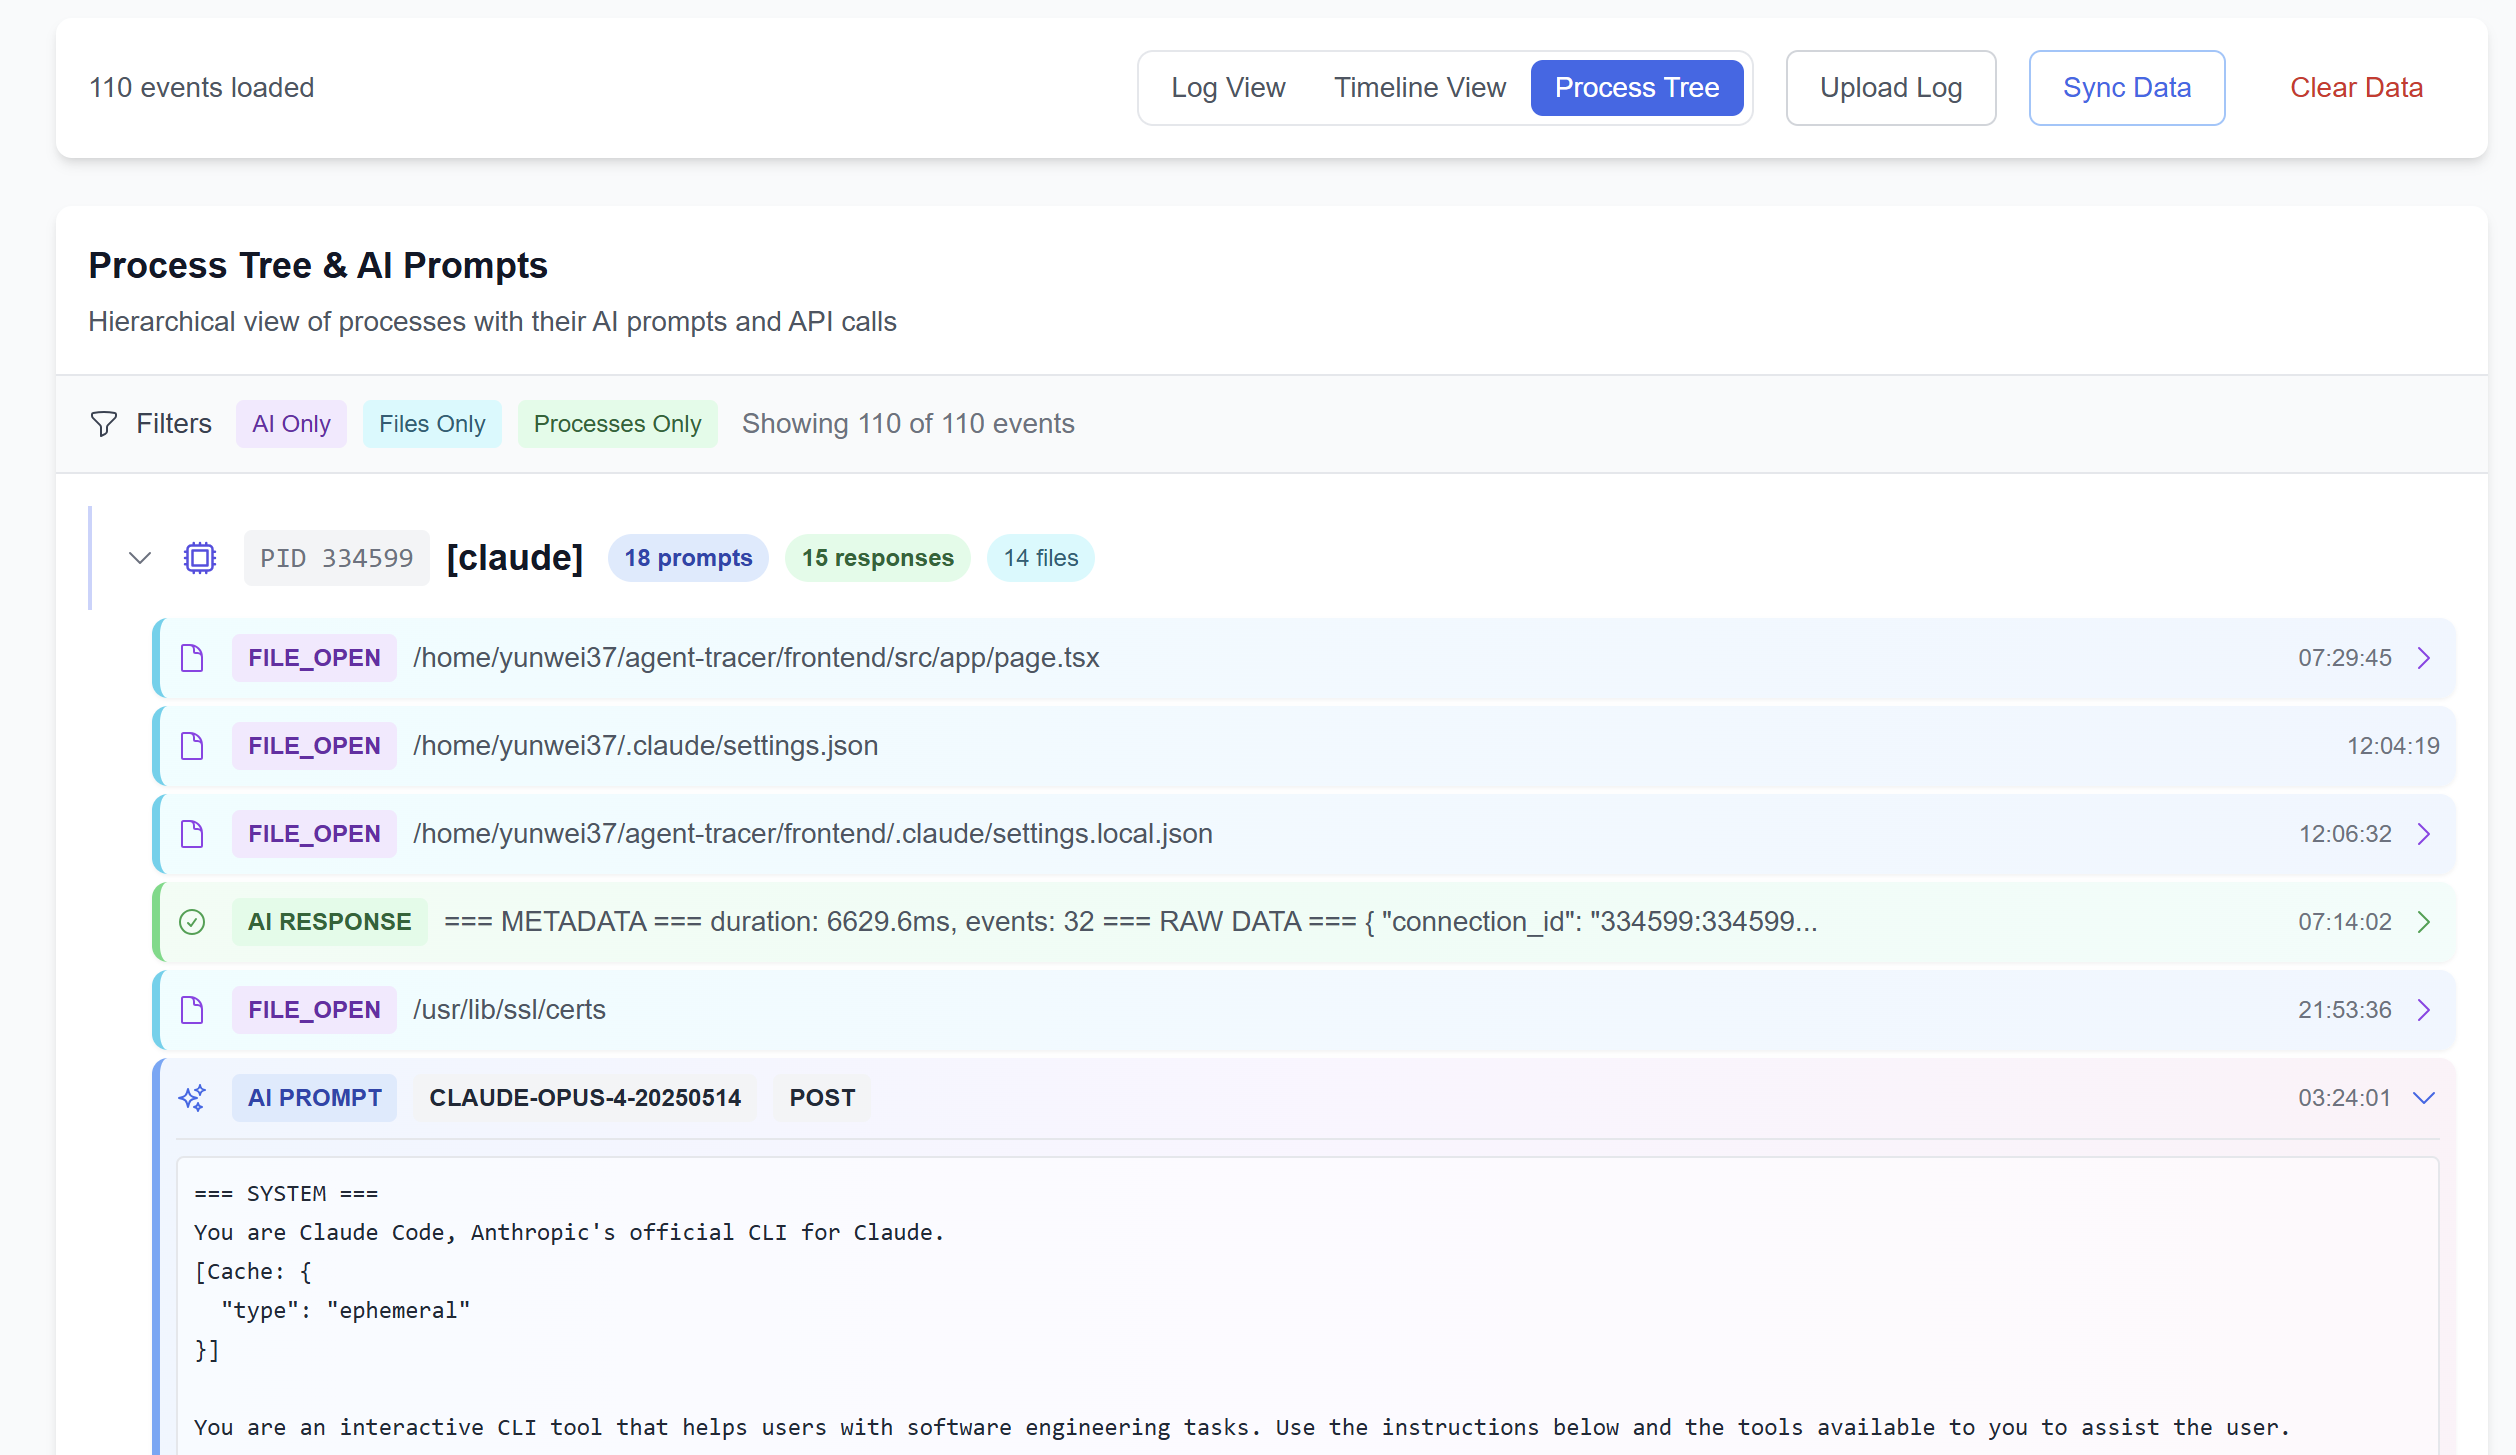
Resource metrics
Compare CPU and memory behavior with the model and tool activity happening at the same time.
Open this view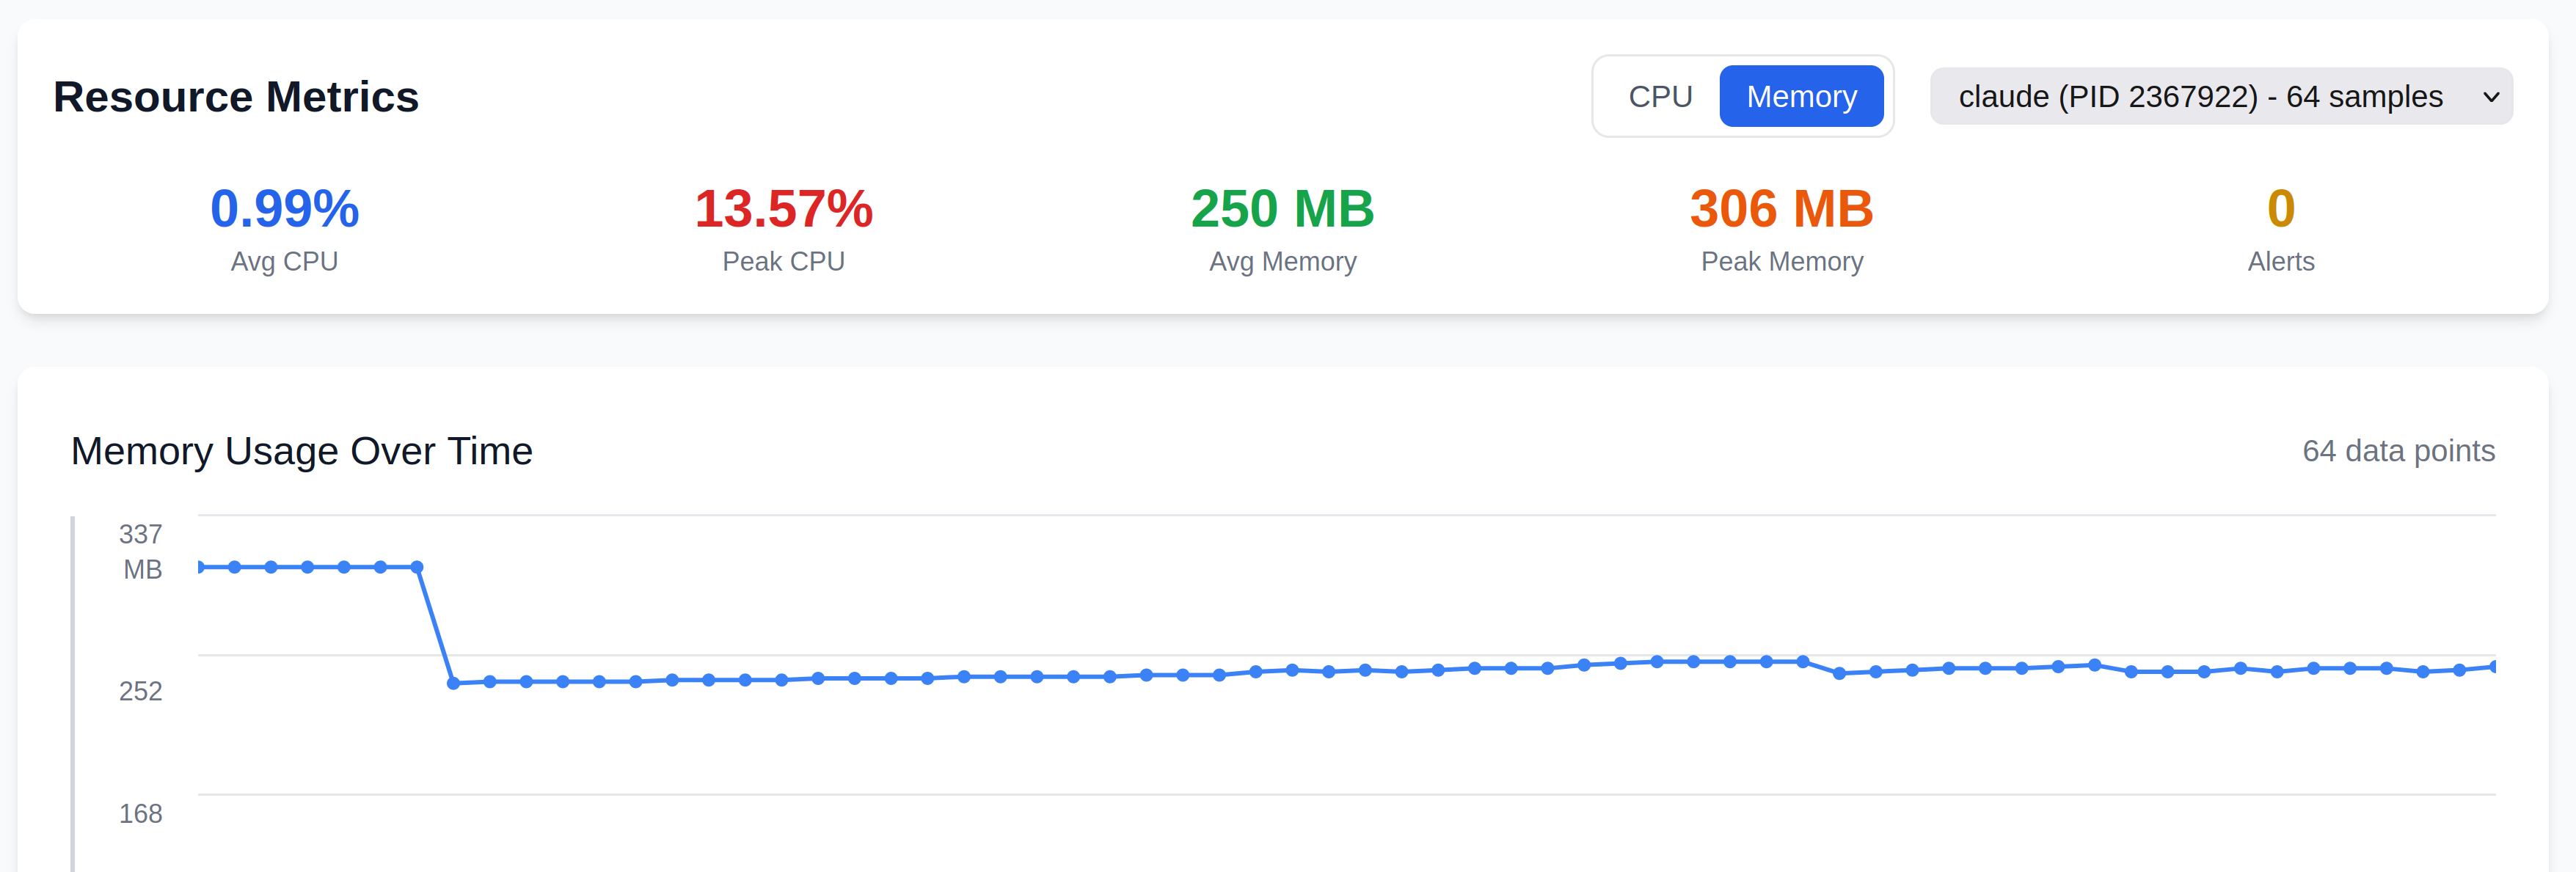
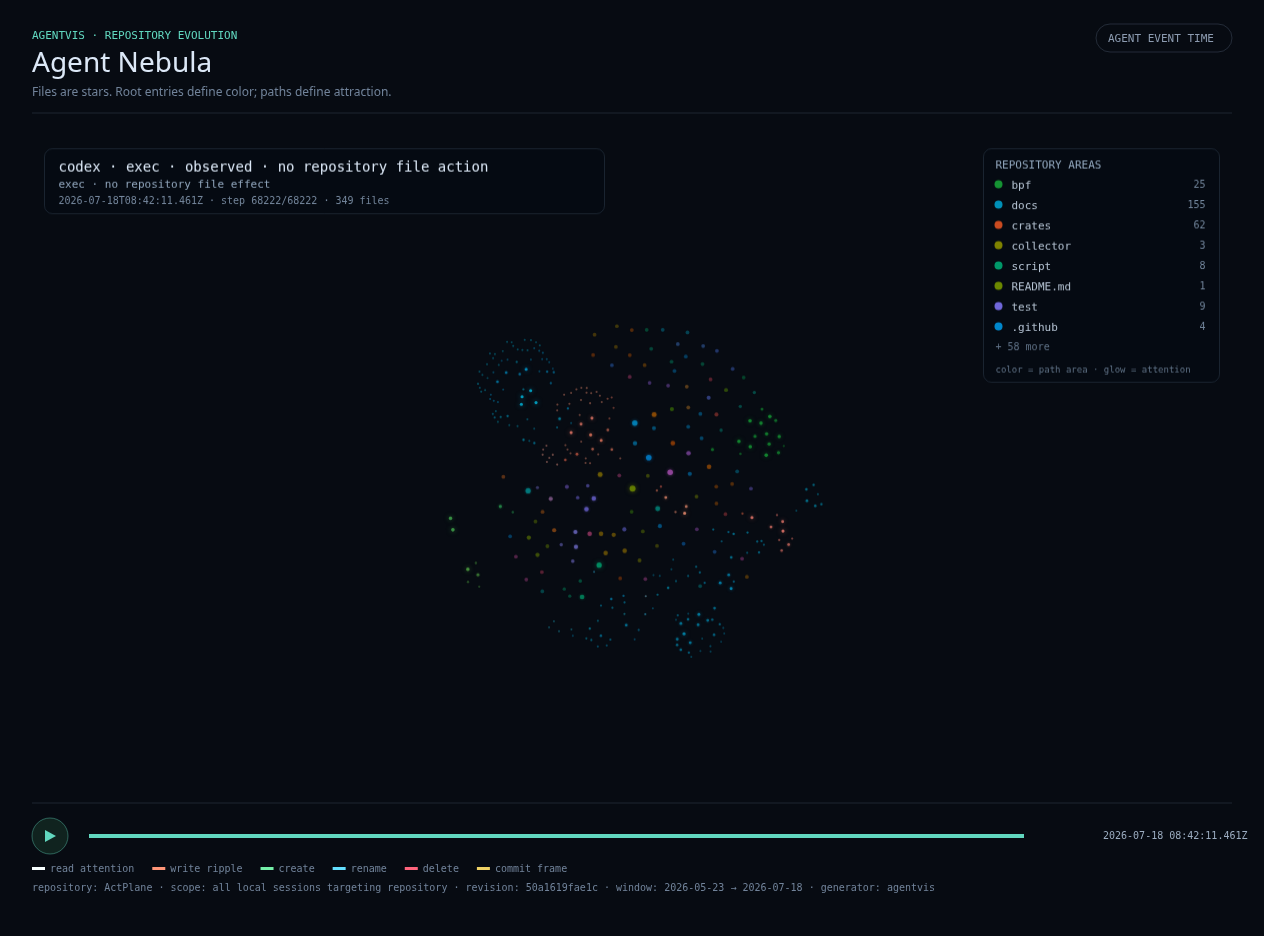
Repository replay
Agent Nebula replays file reads, writes, creates, renames, and deletes across a Git worktree.
Agent Flamegraph
Aggregate real local agent sessions by project, agent, prompt category, model, and token type.

Product screenshots and examples are pinned to AgentSight commit 07a83a32257b8c8dcba911bd9db23f77e71dc085.
After the run
A recorded run is a reusable local artifact. Use focused report commands, the saved-session web UI, repository replay, and profiling views without turning the product website into duplicate CLI documentation.
agentsight report audit --jsonInspect process spawns, file opens, and captured API activity from a saved run instead of relying on the final agent answer alone.
Review data and security →agentsight report tokenSummarize token usage from the latest AgentSight database or supported local agent sessions, then move to Agent Flamegraphs for deeper aggregation.
Explore token profiling →agentsight report serveUse the same Overview, timeline, process-tree, log, and metrics views on saved SQLite sessions after the original command has finished.
Open the recorded demo →agentsight visTurn local Claude, Codex, and Gemini session history into an Agent Nebula replay of reads, writes, creates, renames, and deletes in a Git worktree.
See the review workflow →Built for real engineering work
Use AgentSight when the final answer or code diff is not enough to explain how the agent reached it or what it changed along the way.
Performance use case
Find where an AI agent run spent time and tokens by connecting model calls to commands, files, waits, and process activity.
Read the pageCode review use case
Review an AI-generated change with the commands, tests, retries, file effects, and network activity that produced it.
Read the pageCompatibility use case
Observe local AI agent commands and child processes without requiring an SDK, source change, proxy, or vendor-specific callback.
Read the pageExtension audit use case
Run an agent extension under system-level tracing to inspect its subprocesses, file changes, remote calls, and resource cost.
Read the pageStandards comparison
Understand how AgentSight system profiles relate to OpenTelemetry instrumentation, traces, semantic conventions, and backends.
Read the pageClaude Code integration
Record Claude Code from the system boundary and connect model activity to commands, files, processes, network calls, and resources.
Read the pageResearch and operating boundaries
AgentSight is an open-source systems project with a published paper, versioned source, public product artifacts, and explicit data-handling limits. The website should expose those facts directly.
We reviewed current Claude Code telemetry, Gemini CLI at an exact commit, Codex OpenTelemetry source, OpenTelemetry GenAI conventions, MCP, and AgentSight. Native telemetry is already rich; independent system observation becomes most useful when execution crosses into descendant processes and low-level effects.
Read the boundary map →The AgentSight paper describes boundary tracing, correlation across model and system activity, the system design, and the evaluation behind the project.
Read the paper on arXiv →Session databases and exports can contain prompts, responses, paths, headers, and network targets. Keep raw artifacts local or handle them with the same care as other development telemetry.
Read Security and data handling →Open source and local first
AgentSight records locally, works with closed-source CLIs, and exports captured model calls as OpenTelemetry GenAI spans when you want to connect them to an existing telemetry stack.
agentsight topsudo agentsight record -- claudeagentsight report audit --jsonagentsight report tokenTry AgentSight
No registration. Inspect the product before recording a run on your own Linux machine.